Why Your AI Agent Dashboard Is Lying to You
What Amazon, Duolingo, and the mobile gaming industry learned about measuring what actually matters
Your AI agent has good uptime, sub-second latency, zero errors in the logs, and a lot of people trying it out. None of that tells you whether it is actually working.
Most teams shipping AI agents track familiar numbers: latency, uptime, error rates, token consumption, message counts, acceptance rates. These metrics feel informative because they map to monitoring patterns engineers already know. They are also dangerously shallow.
Green Dashboards, Flat Business Metrics
Consider a team that ships a RAG-powered support agent and instruments everything properly. Three months in, the dashboard is green across the board, but ticket volume has not decreased and CSAT is flat. When they finally read actual conversations, they discover the agent retrieves documents, generates plausible responses, and is completely unhelpful. A user asking how to migrate between pricing tiers gets a paragraph about plan features instead of the step-by-step instructions buried in a lower-ranked document. No error was thrown, no timeout occurred. The system was healthy. The answers were useless.
There is a second way the dashboard lies. AI is novel, and everyone wants to try it. Launch a copilot or an agent and you get a usage surge driven by curiosity — people testing boundaries, showing it to colleagues. The numbers look fantastic for the first few weeks. But curiosity is not value. Without metrics that distinguish a user who tried the agent on Tuesday from one who relies on it every day, you are reading vanity metrics dressed up as launch success.
The gap between "is it running?" and "is it delivering value?" is where AI projects quietly fail. Closing it requires a different measurement framework, and three industries have already figured out how.
Amazon: Separate What You Control from What You Cannot
In Working Backwards, former Amazon VPs Colin Bryar and Bill Carr describe the measurement philosophy behind Amazon's growth. The core idea is deceptively simple: every business metric is either an output or an input, and most companies obsess over the wrong category.
Output metrics are the results you care about but cannot directly control: revenue, CSAT, retention. They are lagging indicators. By the time one moves, the causes are weeks or months in the past.
Input metrics are the controllable, customer-facing activities that drive the desired outputs. Amazon identified three core inputs for retail: selection, price, and convenience. A good input metric is controllable by a specific team, directly tied to what the customer experiences, measurable on a short cycle, and clearly owned.
The most instructive part of the book is how Amazon iterated to find the right input metric for selection. "Number of product detail pages" led teams to add millions of pages nobody wanted. "Number of detail page views" counted views on out-of-stock items. Adding availability ignored shipping speed. Only the fourth attempt — "Fast Track In Stock," the percentage of page views where the product was in stock and ready for two-day shipping — captured what actually mattered. Finding the right input metric is itself a discipline.
Translated for AI Agents
For AI agents, the output metrics are familiar: revenue influenced by agent interactions, ticket deflection, CSAT, retention, cost savings.
The input metrics are where the work happens. Retrieval relevance: does the RAG system surface documents that actually contain the answer, not just keyword matches? Response completeness: did the agent address all parts of a multi-part question? Tool selection accuracy: does it call the right API in agentic workflows? Task completion correctness: not "did the agent produce an output" but "was the output right," closing the gap between the 95% completion rate and the 70% correctness rate we documented in our previous post on agent evaluation. Time to resolution: not how fast the agent responds (that is latency) but how quickly the user achieves their goal — a fast response that requires three follow-ups is slower than a thorough one that resolves the issue immediately.
Most teams start with input metrics that sound reasonable but drive wrong behavior. "Number of queries handled" rewards throughput regardless of quality. "User rating per conversation" creates selection bias — only frustrated or delighted users leave ratings. The right input metrics require the same iterative discipline Amazon demonstrated: start with your best guess, measure downstream effects on outputs, and refine until the connection is genuine.
Duolingo: Track User States, Not Just User Counts
Amazon's framework tells you what kind of metrics to track. The next question is: which ones matter most for AI products?
Most AI features follow the same adoption pattern: launch as freemium inside an existing product, educate users on what the AI can do, drive engagement, then upsell to a premium tier. This progression — from awareness to trial to habitual use to monetization — is the lifecycle every AI product team needs to measure.
Duolingo is the perfect case study because this progression is their entire business. Their free tier teaches with AI-powered lessons; their premium tier unlocks advanced AI features like conversational practice. Every product decision moves users through that funnel.
To measure it, Duolingo's growth team built a user state machine under former CPO Jorge Mazal. On any given day, every user is in exactly one state. Active states (New, Current, Reactivated, Resurrected) contribute to DAU. Inactive states (At-Risk, Dormant) represent disengagement. Users flow between states, and the transition probabilities tell you exactly where value is being created or destroyed.
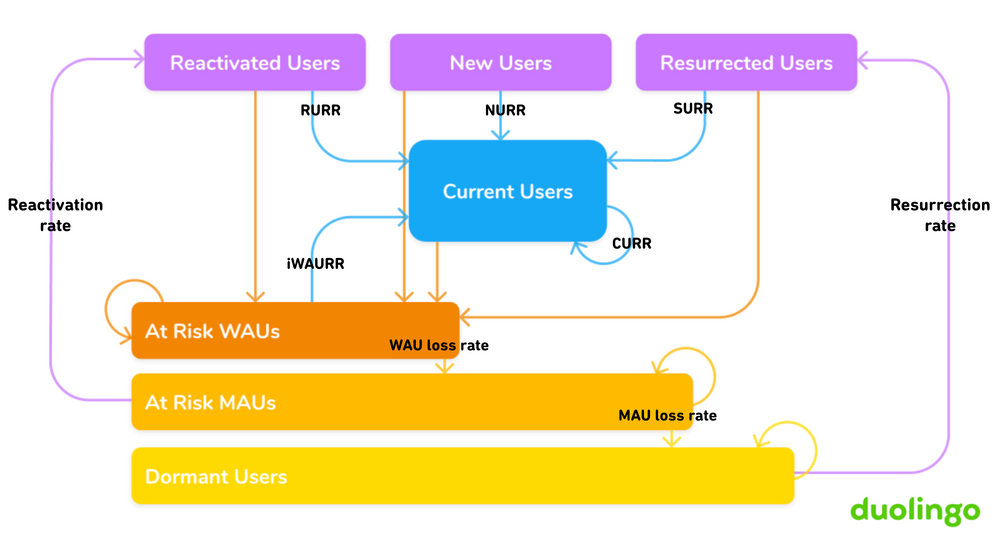 Duolingo's user state machine. Each user is in exactly one state on any given day. Source: Duolingo Blog.
The insight that reshaped their product organization: the single most important transition is keeping current users current. Small, steady improvements in that one retention rate compounded over years to drive 4.5x DAU growth. Not acquisition, not reactivation — just reducing the daily drip of engaged users drifting away.
For AI agents, the states map naturally: New (first interaction), Exploring (testing capabilities), Engaged (regular use in real workflows), and Power User (expanding across use cases). The inactive states are At-Risk (declining usage, simpler queries), Dormant, and Churned. The most important transition is the one your dashboard is not showing: Engaged to At-Risk. Users do not churn overnight. They gradually reduce usage, sessions get shorter, queries become simpler — as if they have lowered their expectations. This drift is almost always caused by silent failures, not crashes but a gradual quality degradation that no alert catches. The state machine makes it visible before it hits your output metrics.
Mobile Gaming: When Every User Is a Different Product
There is one more challenge the first two frameworks do not fully address. Everyone who opens Duolingo for their first Spanish lesson gets more or less the same experience. AI is different: every user prompts differently, solves different problems, defines "value" differently.
Mobile gaming figured this out years ago. Even players in the same game have completely different experiences — a paying user and a free user see different progression curves; a casual player on a low-end Android and a competitive player on the latest iPhone are experiencing fundamentally different products. Studios must optimize for all segments simultaneously, and they learned that subtle imbalances — matchmaking slightly too loose, one level a hair too difficult — cause gradual churn invisible to system health metrics. The response was extraordinary rigor on segmented metrics, broken down by cohort, geography, platform, and progression stage, backed by disciplined A/B testing and causal inference.
The lesson for AI: a RAG system with slightly off retrieval ranking is like a game with slightly off matchmaking. The system works, no failure is visible, and users quietly lose confidence. Your metrics need the same segmentation — by user state, by use case, by query complexity — to catch the subtle degradation that aggregate numbers hide. How to run these experiments on AI agents deserves its own treatment in Part 2.
The Weekly Agent Review
Amazon runs a Weekly Business Review where the executive team reviews hundreds of metrics in 60 minutes, exception-driven: discussion happens only on anomalies. The same cadence works for AI agents, covering three layers. First, user state flow: are more users flowing into At-Risk than into Engaged? Second, input metrics: did retrieval relevance, response completeness, or task correctness move outside normal range? Third, output metrics: revenue impact, deflection rate, CSAT, retention — confirming or contradicting what the inputs predict.
This structure aligns incentives across the organization. Product managers own user state transitions. Engineers own input metrics. Leadership traces drops in agent-influenced revenue through state transitions to input metrics to specific actions.
Three Silent Failures the Framework Catches
The support agent that "resolved" everything. An agent hits 85% resolution rate, but "resolution" just means the conversation ended. Task completion correctness would be low despite high resolution rate, and the state machine would show users stuck in Exploring — they try it, get a mediocre answer, and solve their problem elsewhere.
The knowledge base that aged out. A RAG system works well at launch. Six months later, usage declines with no errors — the source documents are stale. Document freshness would catch this, and the state machine would show Engaged-to-At-Risk drift: the signature of quality degradation, not system failure.
The sales assistant that lost trust. An AI assistant occasionally gets company details wrong — wrong funding round, confused prospects. Users remain nominally Engaged but query complexity drops: they stop asking for email drafts and only use it for scheduling. The user has not churned, but the value has collapsed.
The Shift That Matters
The teams that struggle with AI agents in production are not struggling with model capability. The models work. The struggle is organizational: teams deploy agents, watch system metrics stay green, and cannot explain why expected business outcomes are not materializing.
This framework changes how you prioritize. When the state machine shows users drifting from Engaged to At-Risk and input metrics point to low task correctness, the highest-impact work is often not a new feature. It might be tweaking prompts, updating retrieval, or fixing UX problems that have nothing to do with the model:
- Build trust incrementally. Surface sources, explain reasoning, show confidence levels. Trust is earned through transparency in every interaction.
- Make actions reversible. Fear of breaking something or sending the wrong email is one of the biggest barriers to AI adoption. An undo button can be worth more than a new capability.
- Make it enjoyable. Users who enjoy the tool come back more, try more things, and forgive more mistakes.
Your AI agent deserves the same rigor Amazon applies to retail, Duolingo applies to retention, and gaming studios apply to game economy. Once you have the right metrics, the next question is how to improve them systematically — A/B tests on prompt strategies, holdout groups for model upgrades, causal inference to separate signal from noise. We will cover that in Part 2.
Carlos Dutra builds production AI systems at Vindler. We specialize in designing the measurement frameworks, evaluation pipelines, and operational cadences that turn AI agents from impressive demos into systems that drive real business outcomes. If your agent dashboard is green but your business metrics are flat, let's talk.